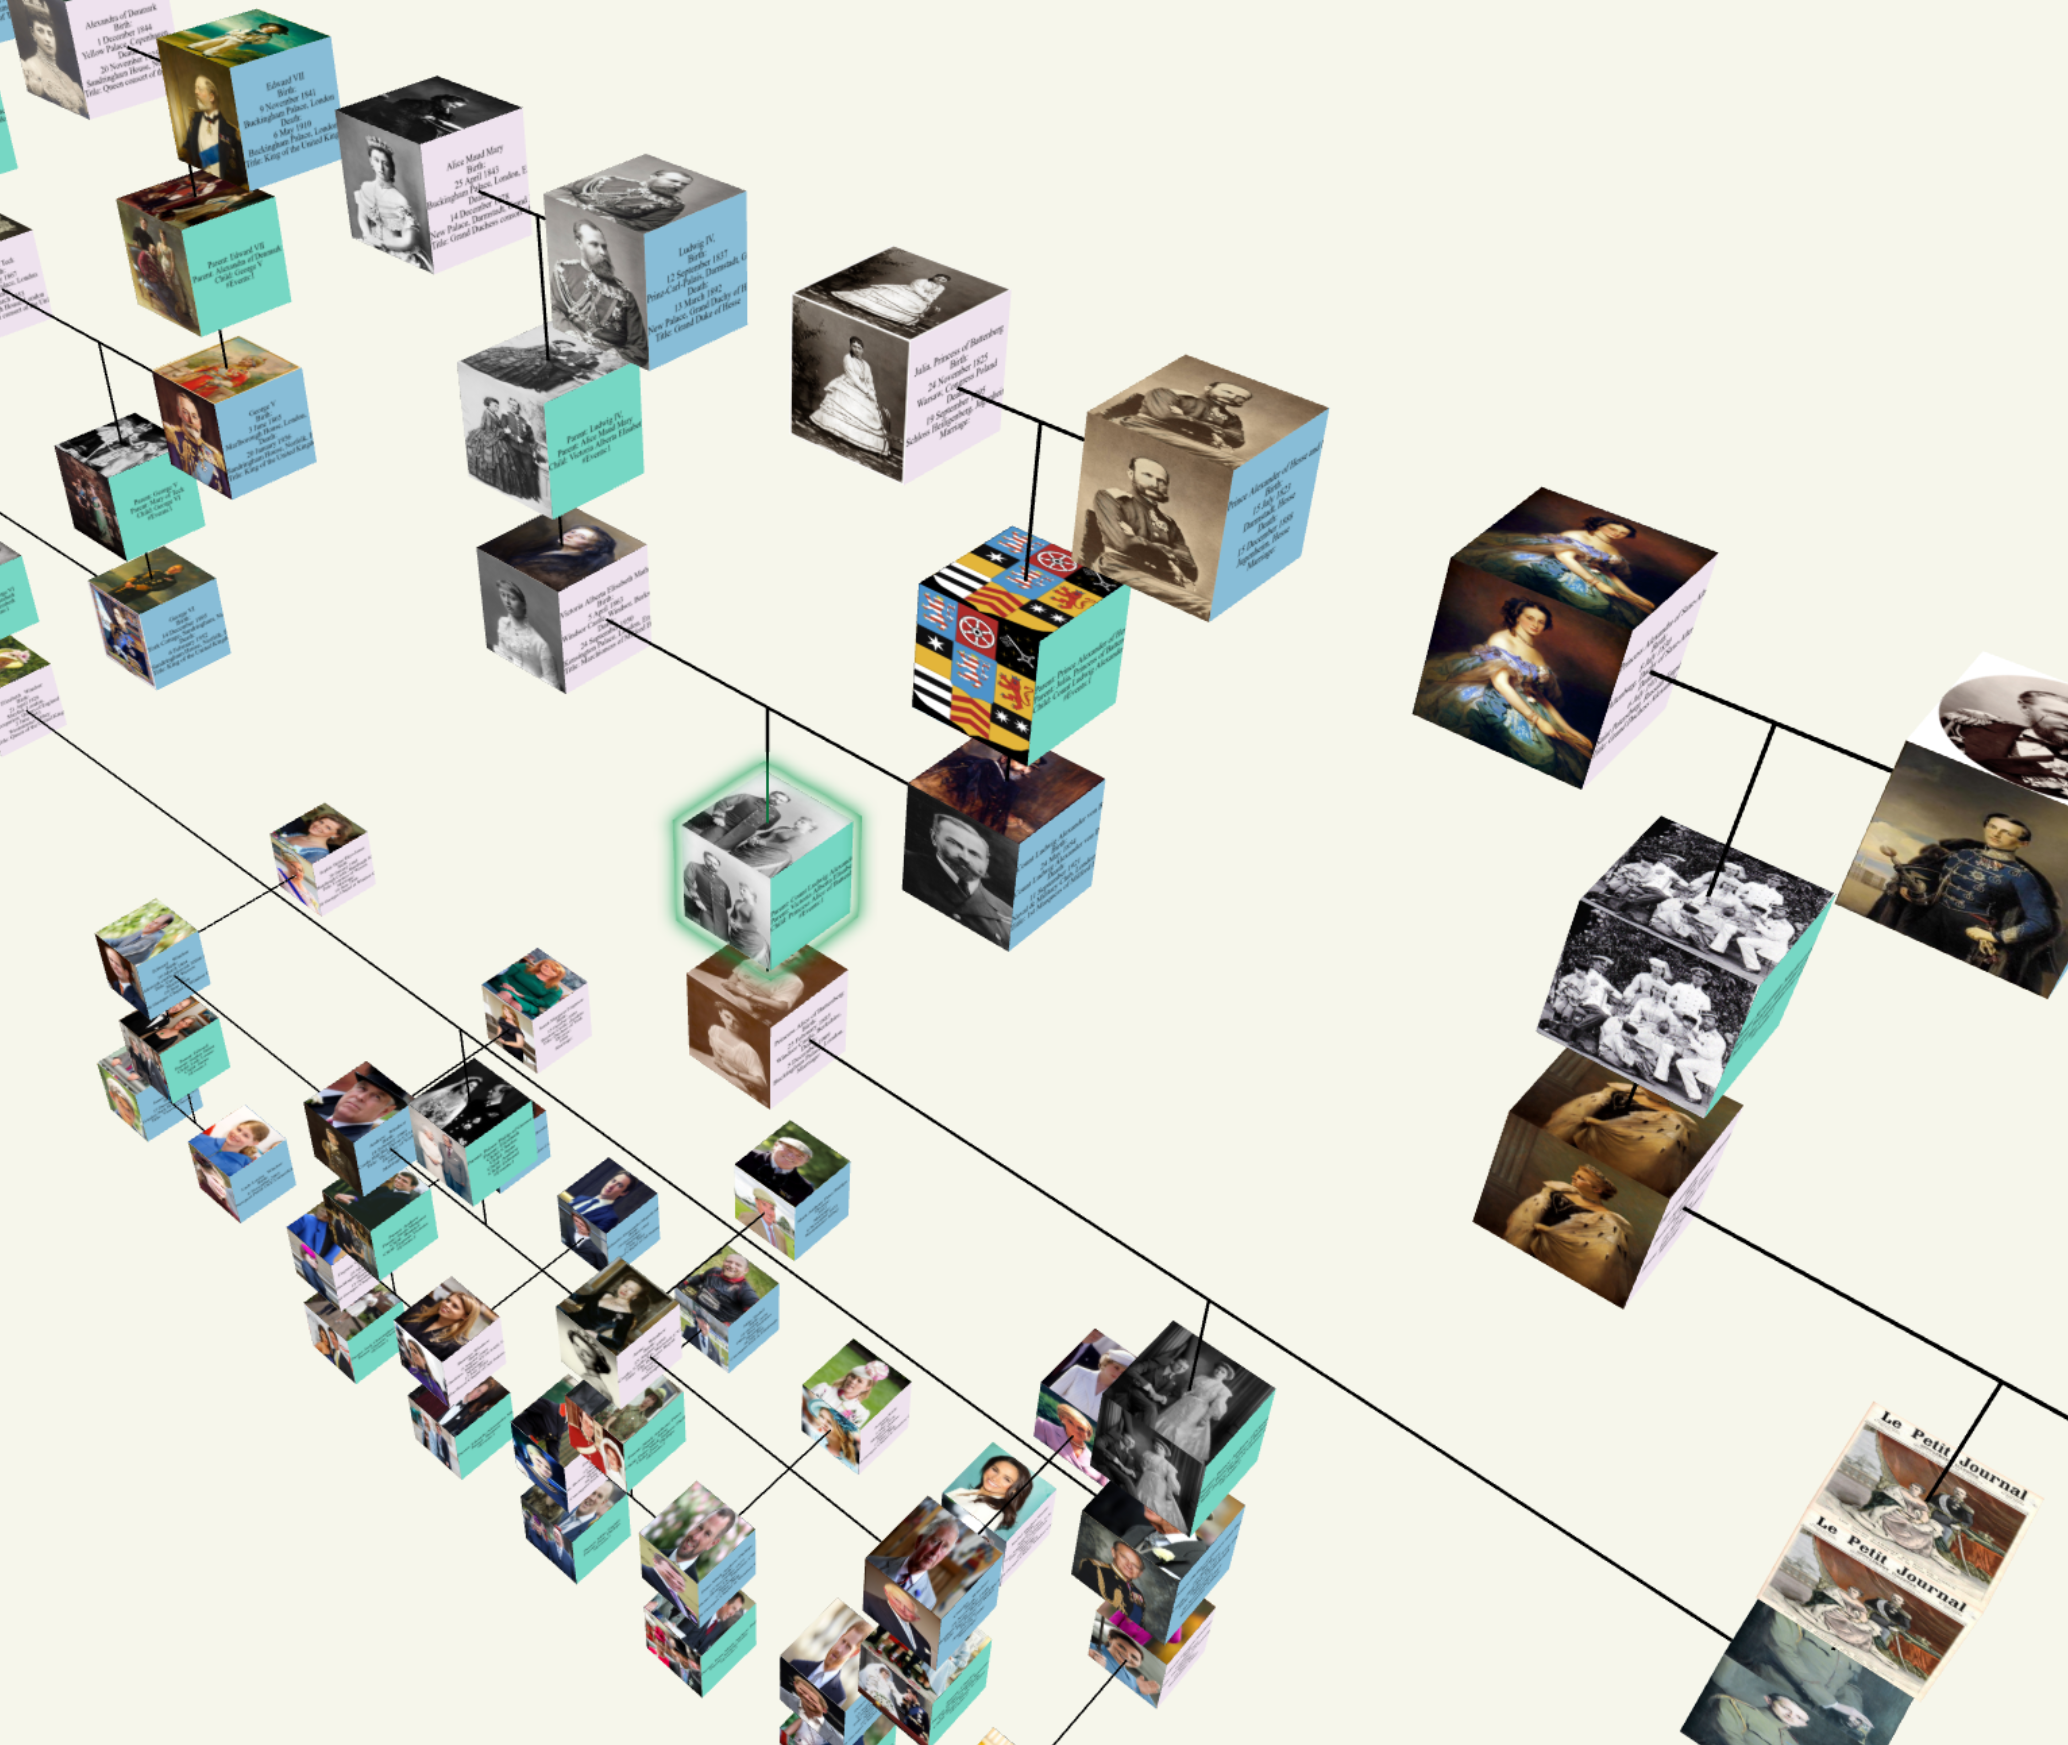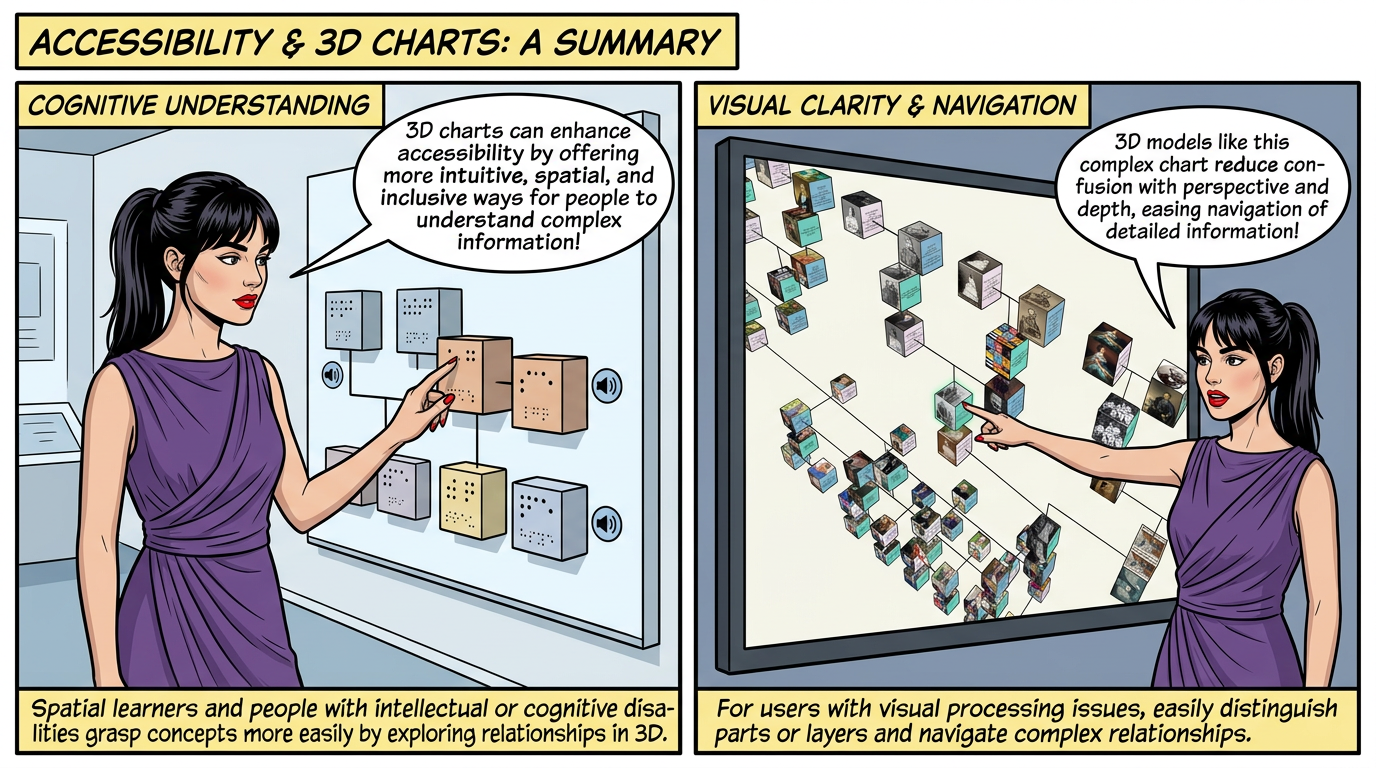
3D charts can enhance accessibility by offering more intuitive, spatial, and inclusive ways for people—especially those with disabilities—to understand complex information.
Here’s how they help:
Improved Cognitive Understanding
Spatial learners and people with intellectual or cognitive disabilities often grasp concepts more easily when they can see and explore relationships in 3D.
Visual Clarity and Navigation
For users with visual processing issues, 3D models can reduce confusion by offering perspective and depth, making it easier to distinguish parts or layers.