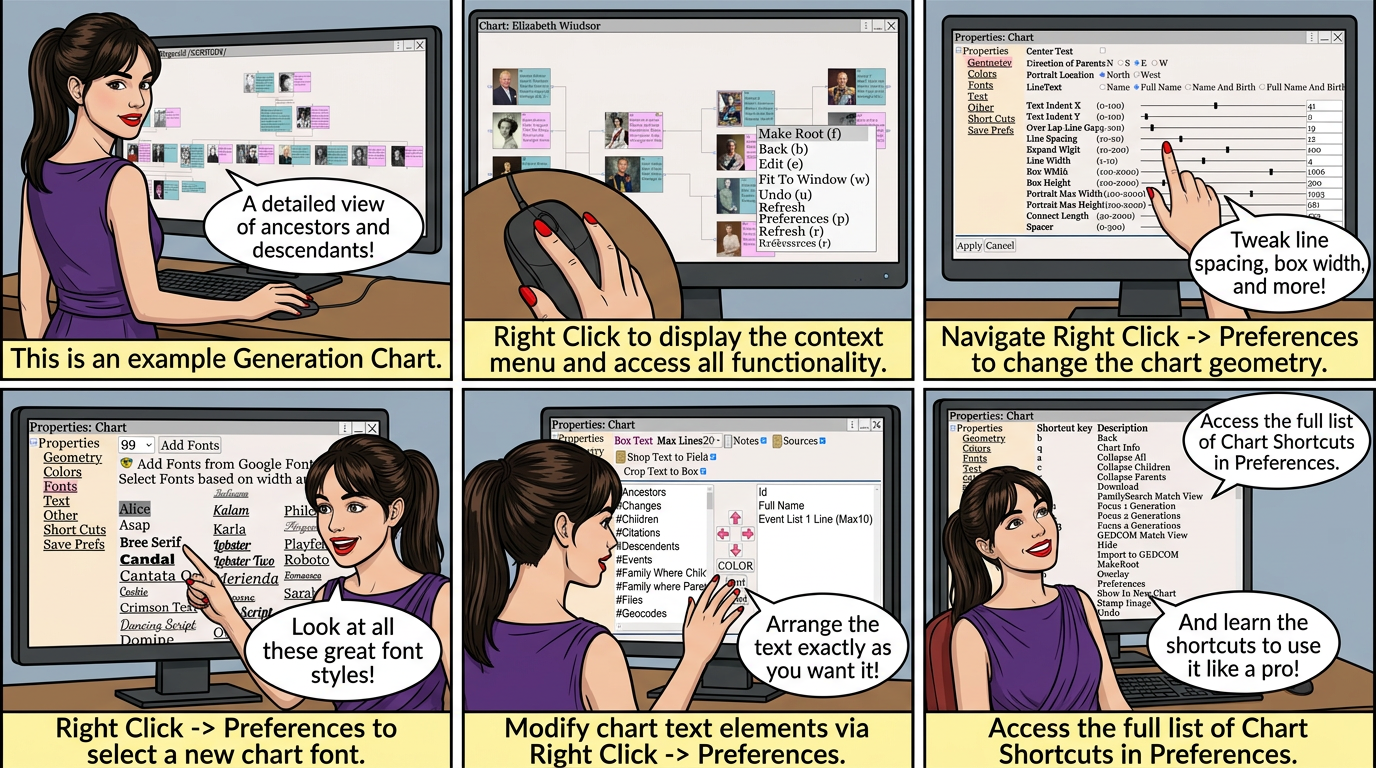
Create the generation chart using ⟶
Chart navigation
• p to view the chart properties - change fonts / geometry
• w to fit the chart to the window
• Ctrl key + mouse scroll wheel to zoom in / out
• Right Click to display the context menu
• Resize the chart window by placing your mouse on the edge/corner of the window
- until the resize cursor appears ↔ ↕
↔
↕
- then hold the left mouse button down and drag
• Press f or F to focus the selected person.
• Panning moves people within the chart. To pan hold down the left mouse button and move the mouse, the cursor changes to

| Left mouse + mouse move | Pan |
| Shift + mouse scroll wheel | Pan left / right |
| Mouse scroll wheel | Pan up / down |
| ← → | Pan left / right |
| ↑ ↓ | Pan up / down |
| ⇞ ⇟ | Page Up / Page Down |
| Ctrl + mouse scroll wheel | Zoom in / out |
• Select a person before zooming to keep them in focus while zooming
• Double Click on a person to edit the person.
• Families are represented by lines. Click the line to select the family.
• Double Click the line to edit the family.
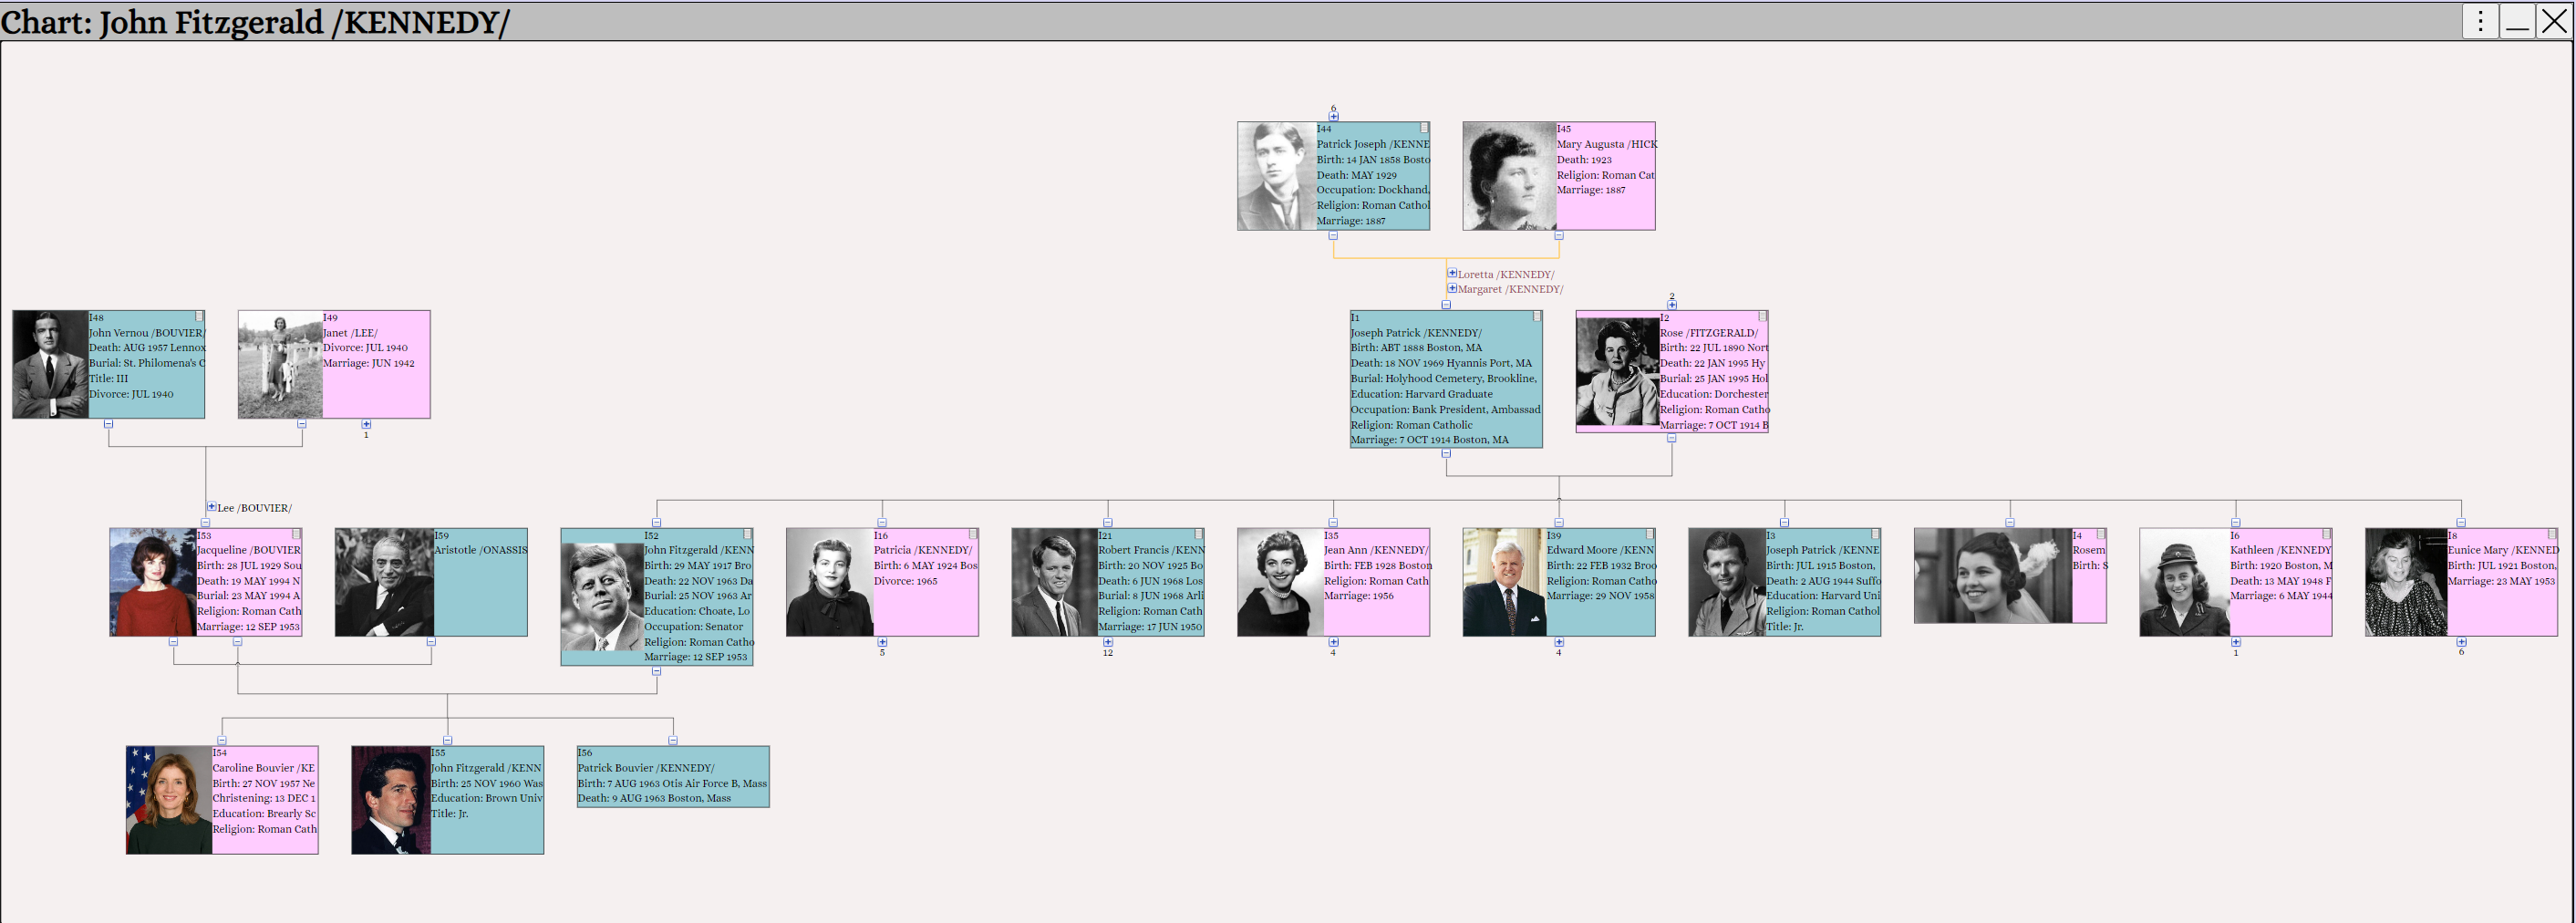
Example generation chart
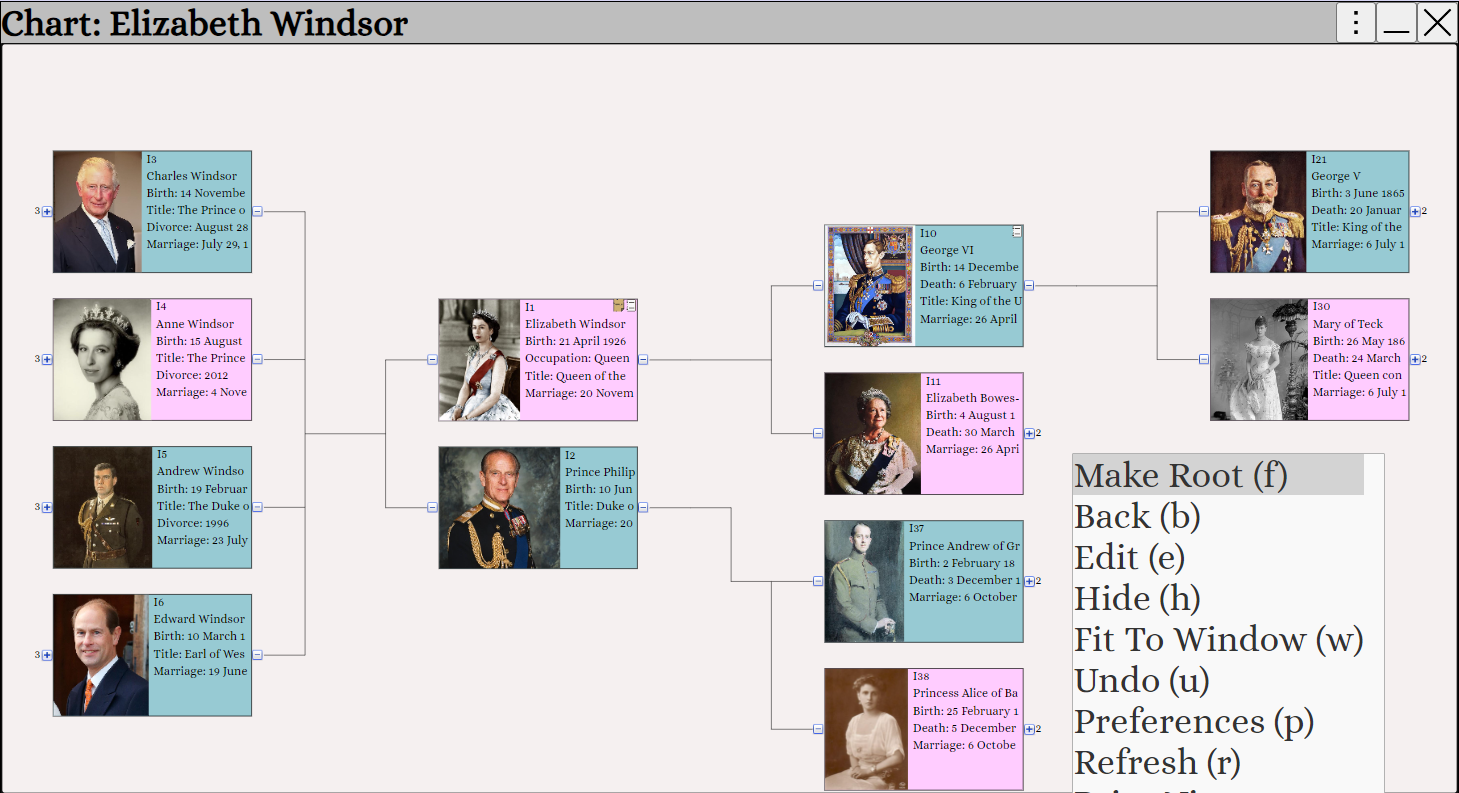
Functionality is accessed through the Right Click menu.
• p to view the chart properties - change fonts / geometry
• w to fit the chart to the window
• Ctrl key + mouse scroll wheel to zoom in / out
• Right Click to display the context menu
• Resize the chart window by placing your mouse on the edge/corner of the window
- until the resize cursor appears ↔ ↕
↔
↕
- then hold the left mouse button down and drag
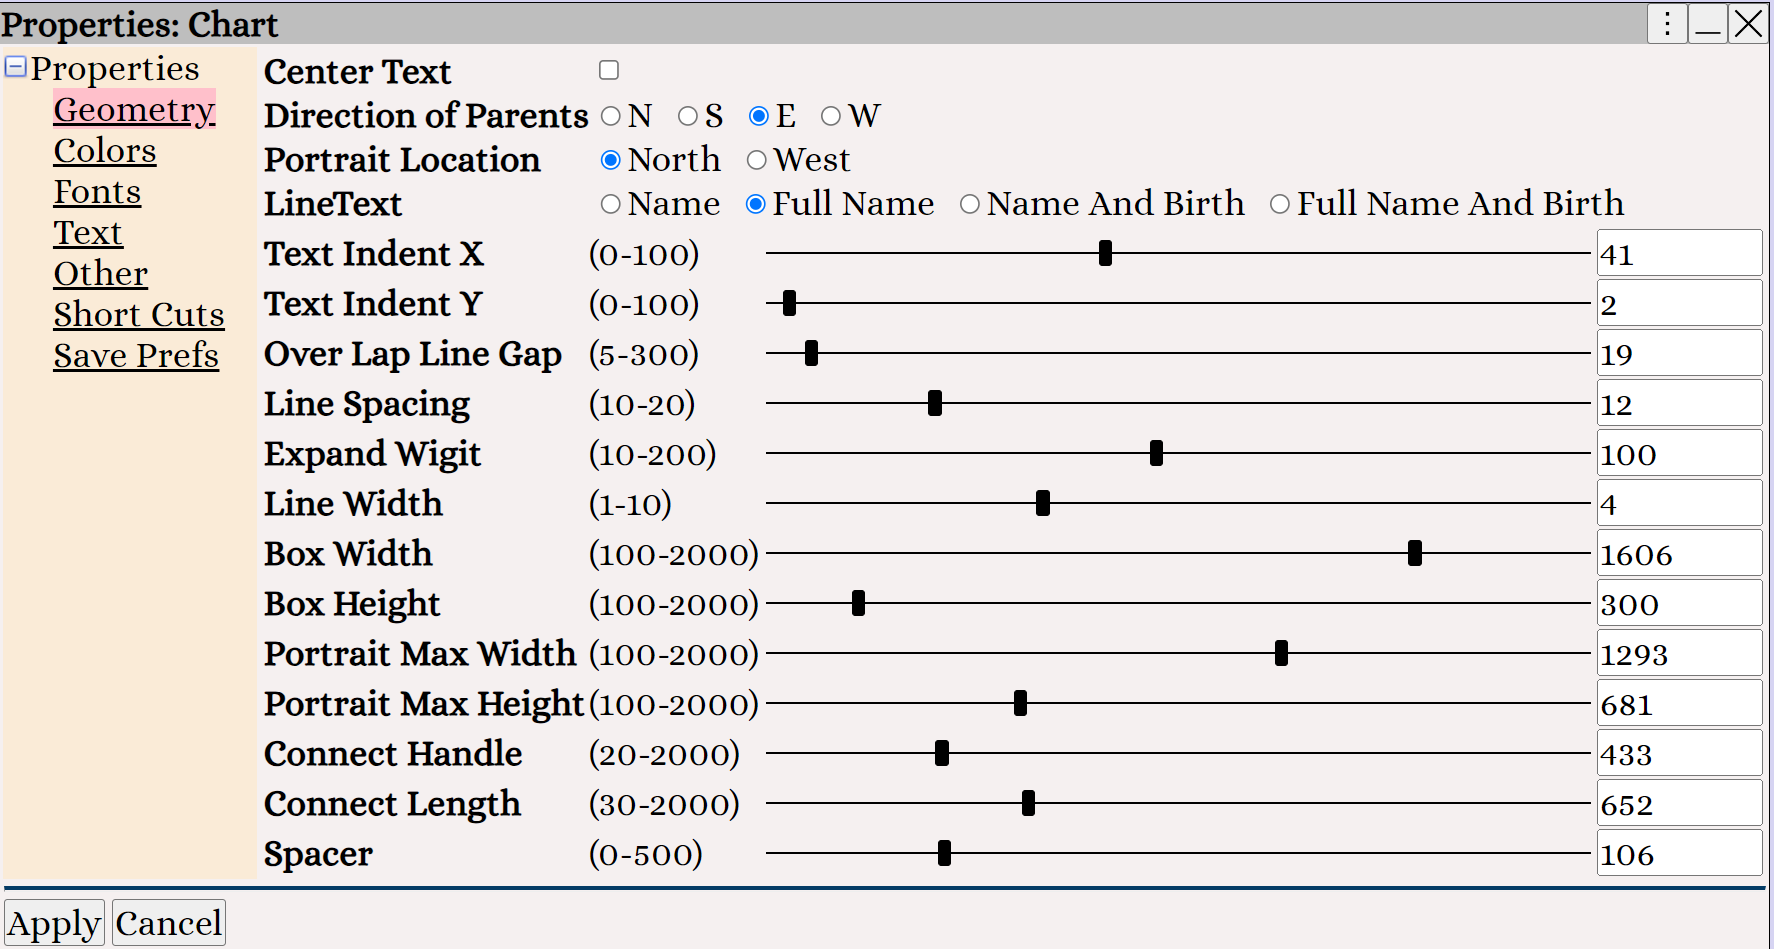
Right Click ⟶ Preferences to change the chart geometry
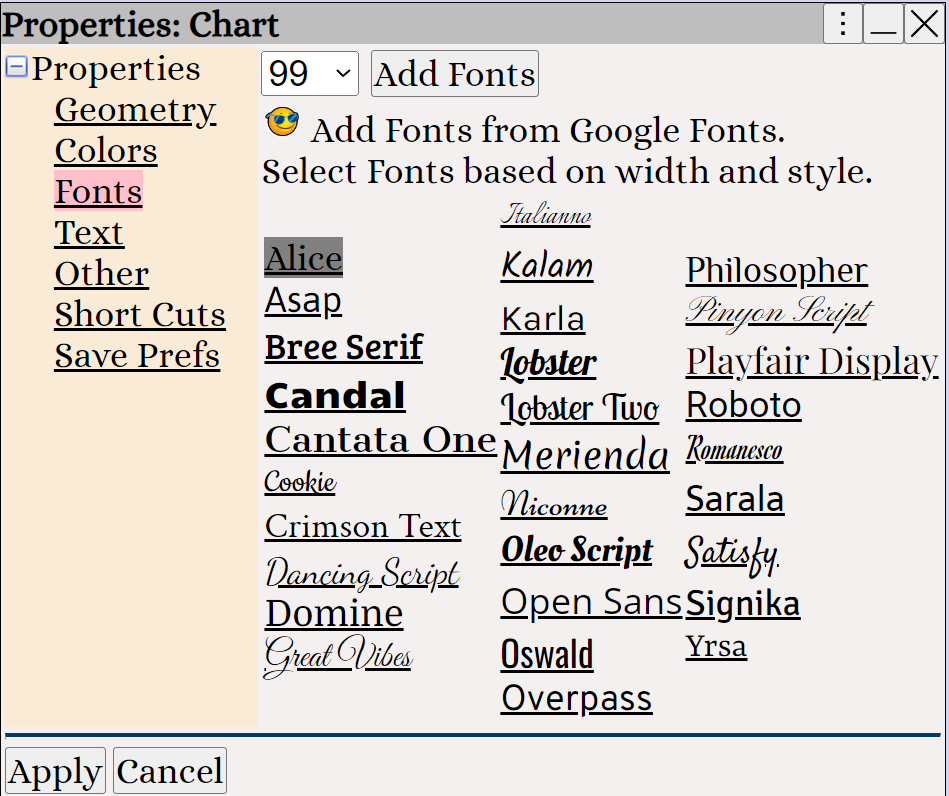
Right Click ⟶ Preferences to change the chart font.
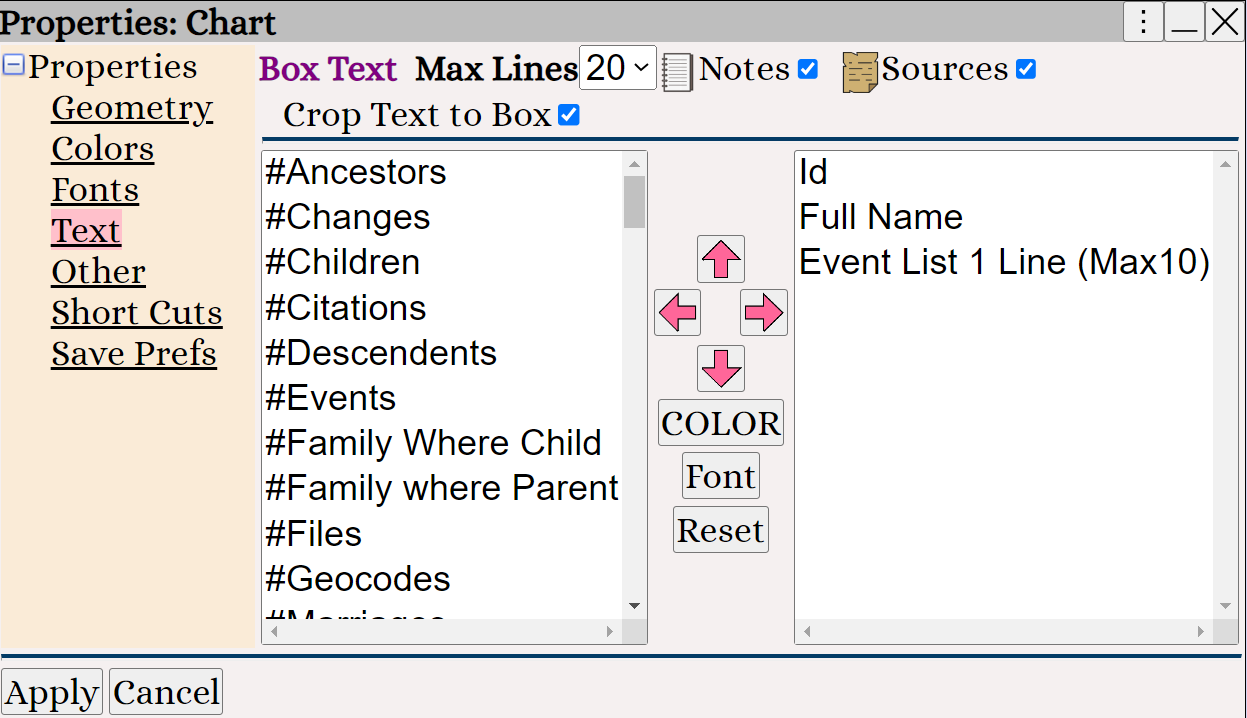
Right Click ⟶ Preferences to change the chart text.
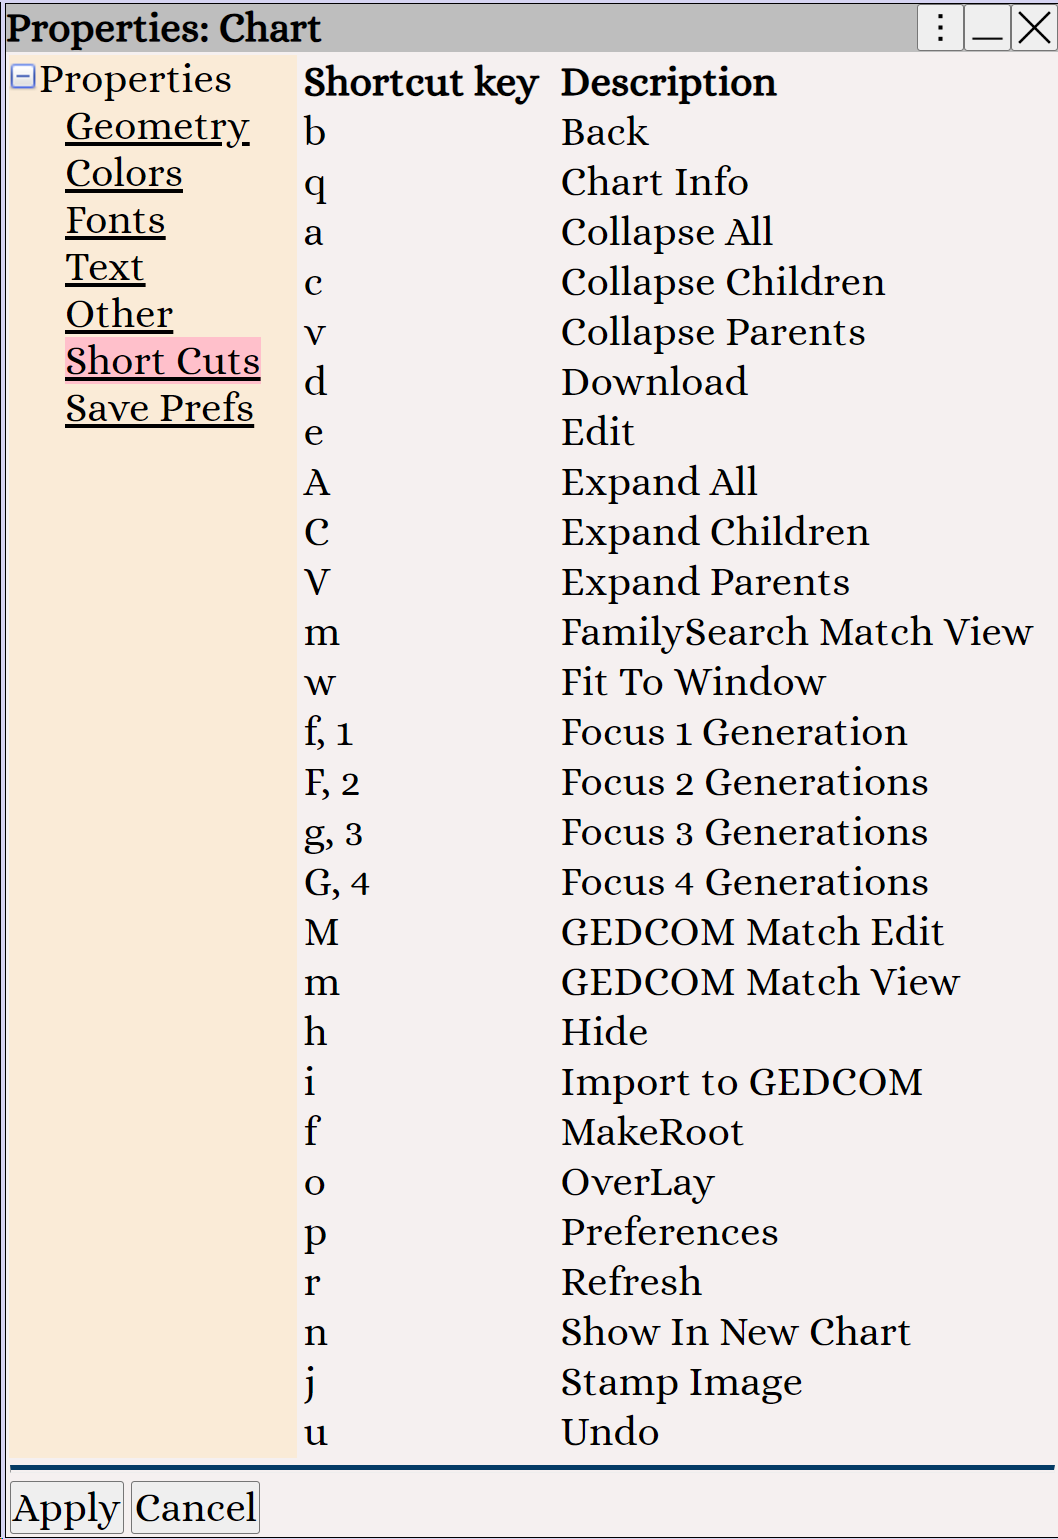
Right Click ⟶ Preferences to view the chart shortcuts.
• To print the chart, please review Charts 2D ⟶ Printing Charts