How to add a title, text, and other graphics to the drawing via overlays
Overlays are like a transparent glass layer where you place text and media.
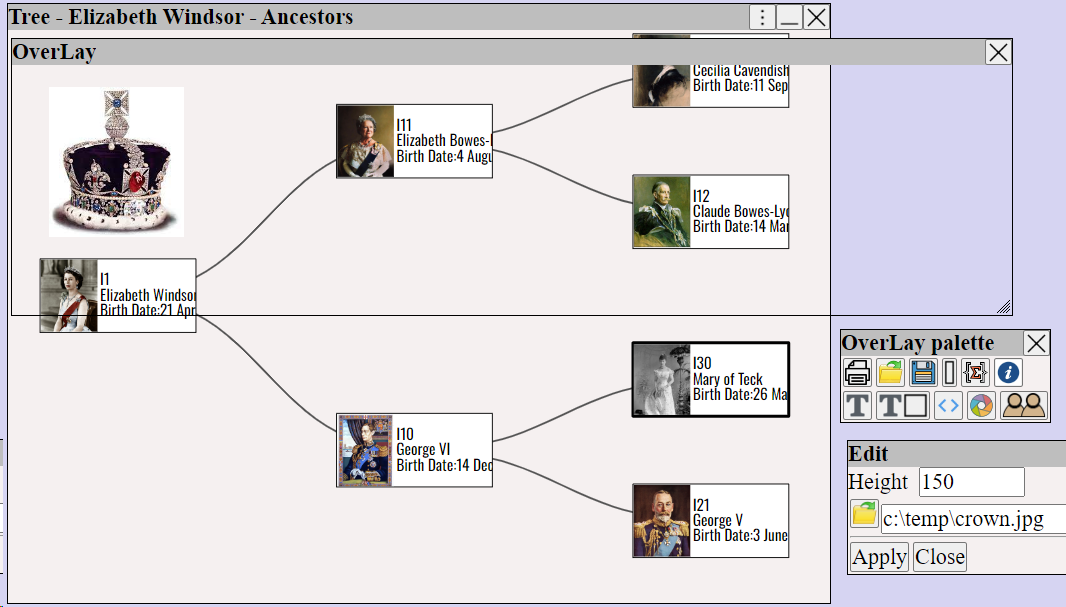
The overlay palette
|
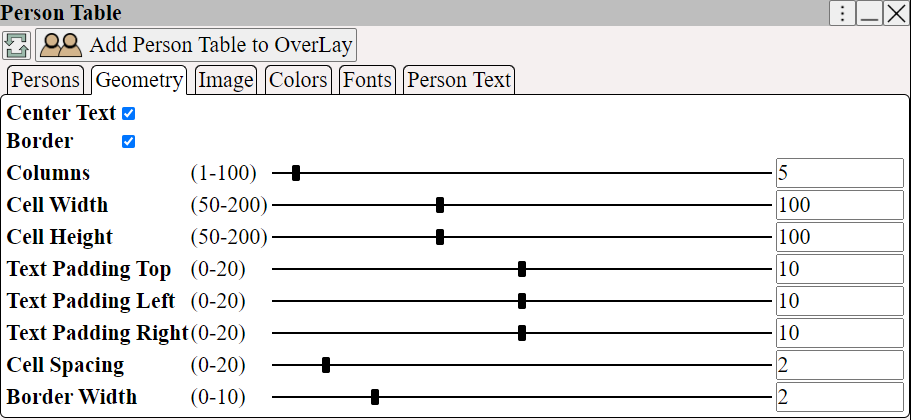
The person table is an index of persons on the chart.
There are many options for styling the table.
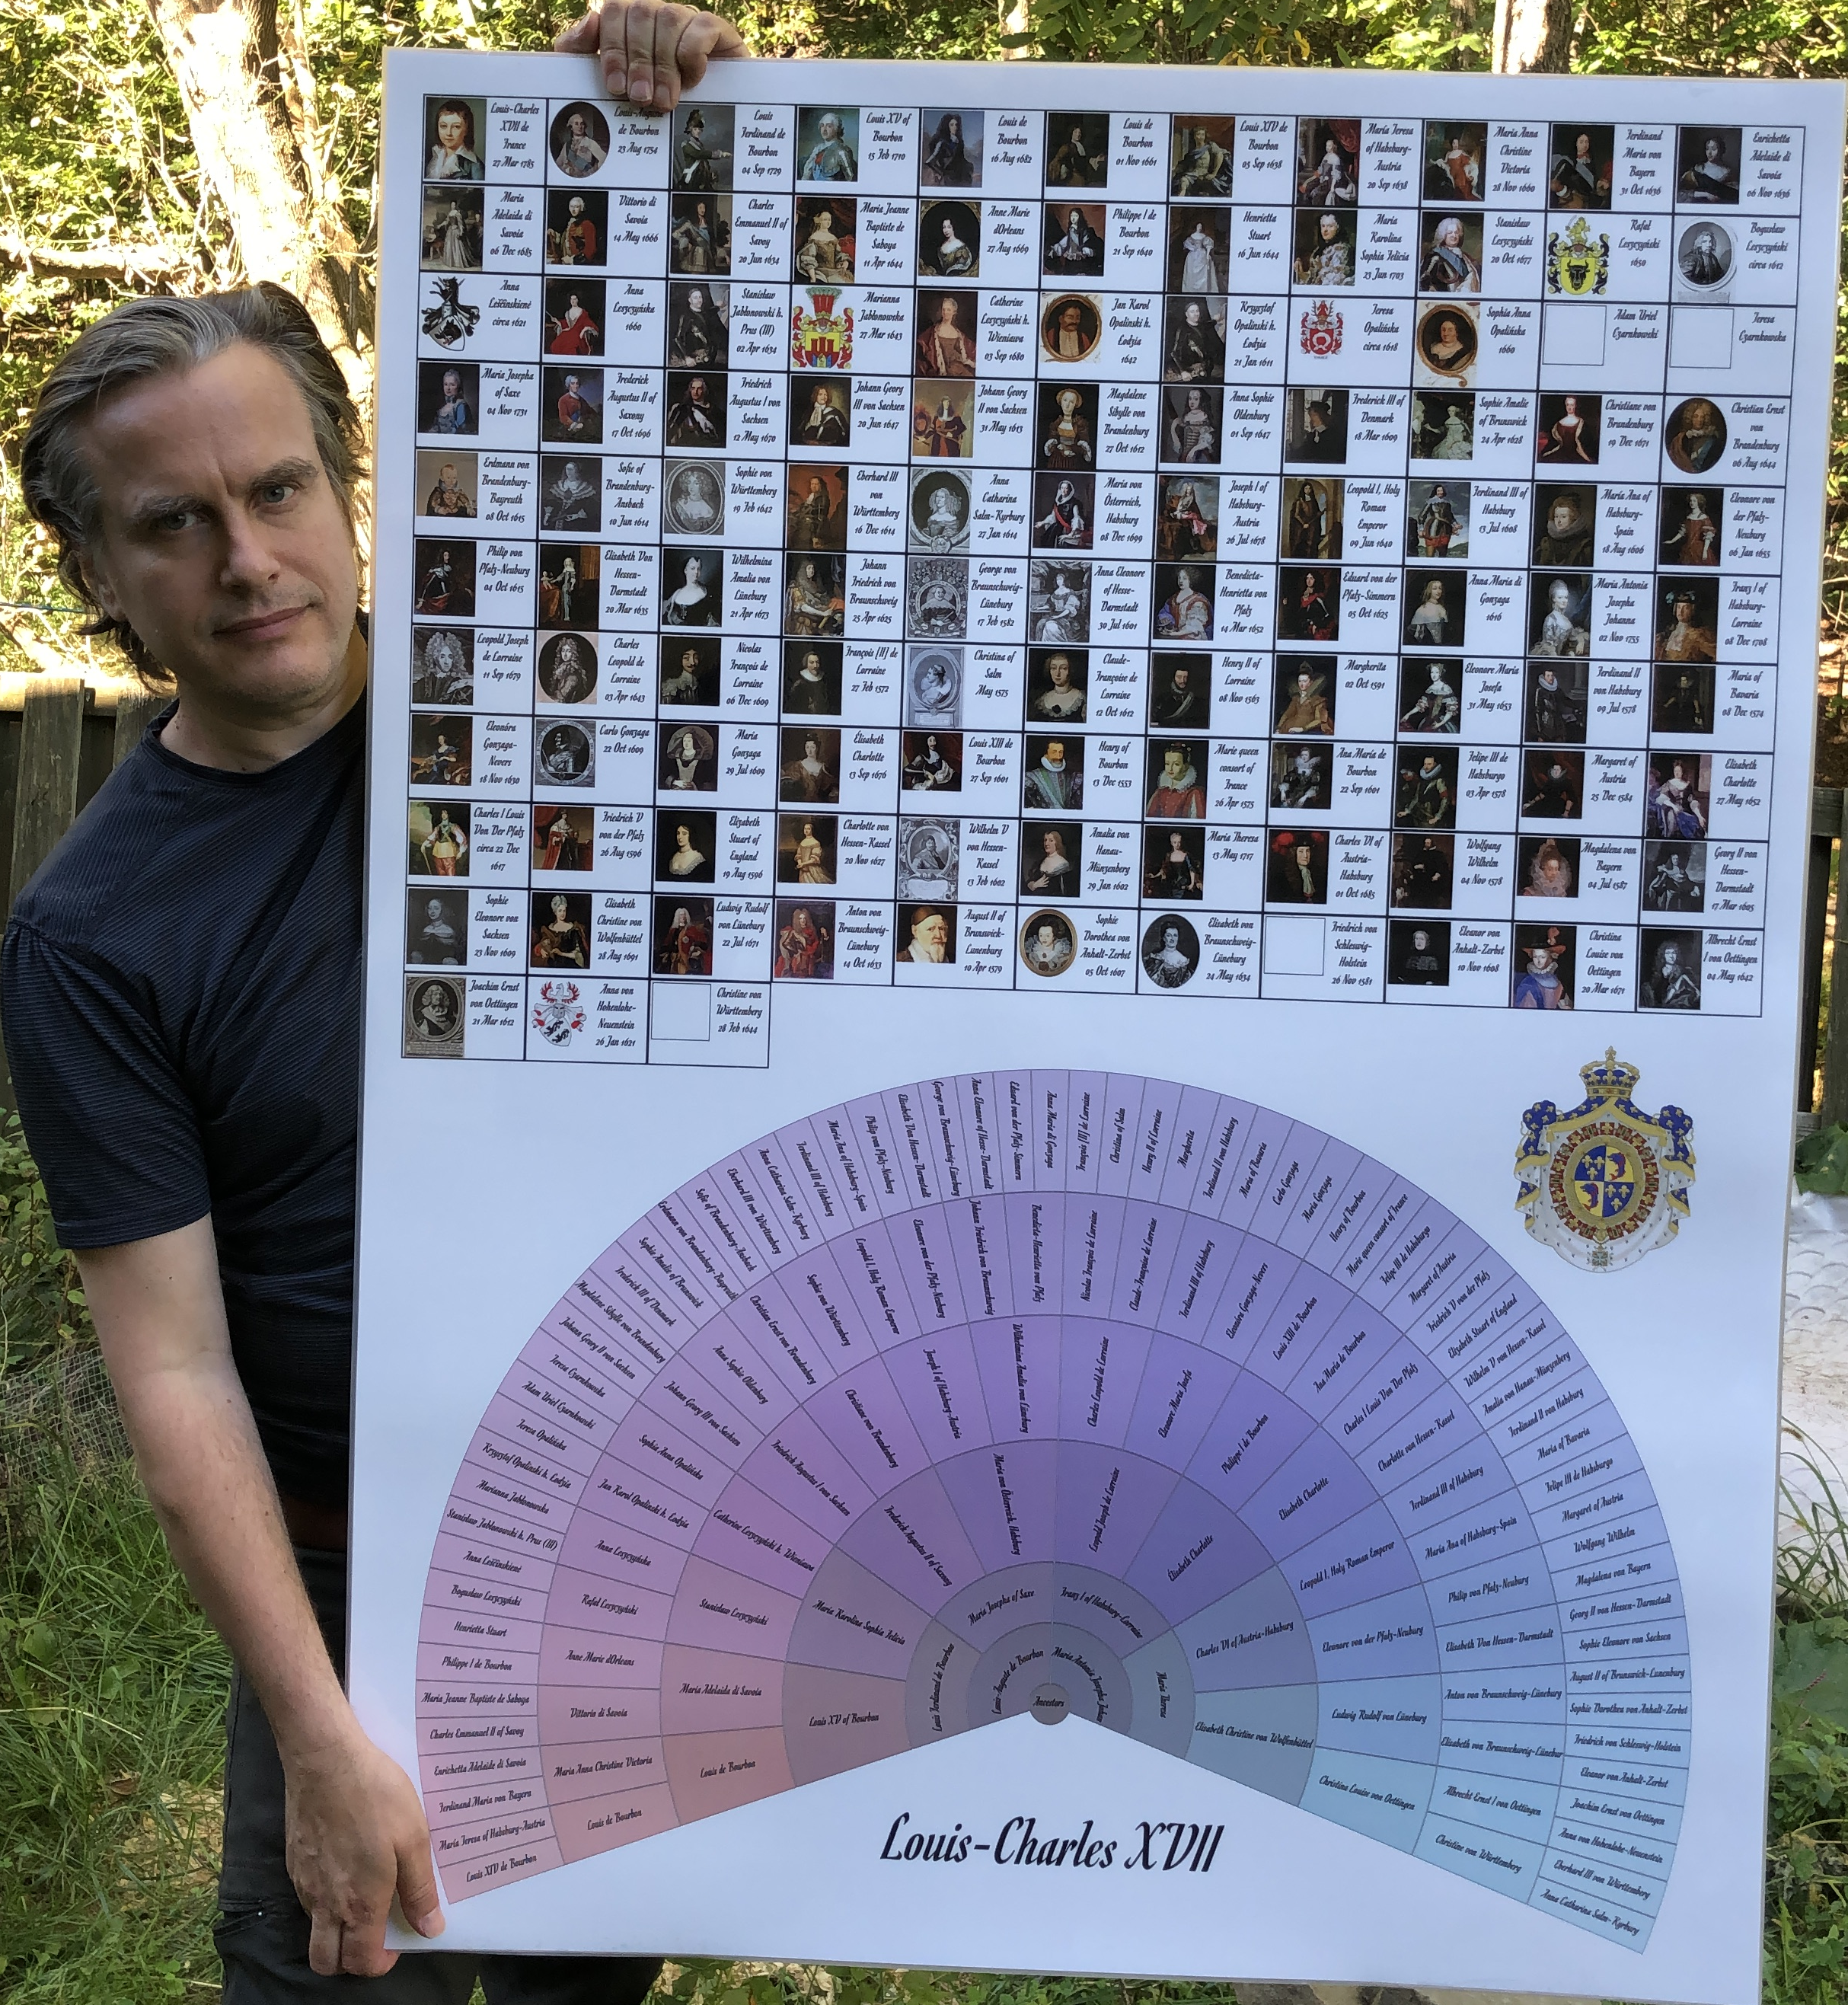
I used an overlay to add a person table and a crest of arms to this fan chart.
• An overlay is like a sheet of glass. Anything underneath the overlay can be seen, but not clicked on.
This can be confusing, as the chart will not respond to mouse clicks with the overlay on.
Just remember the overlay is a sheet of glass, which you can see through, but not click through
• Right Click on an object in the overlay to see the context menu.
From the context menu, you can set the chart in print mode and fit the chart to the window.
Please also review Charts 2D ⟶ Printing Charts .
• Remember, you can save the overlay to a file and reload it later.
• Expand the overlay size from the bottom left corner; by default, it is pretty small, and elements may not show.
• Click on any element in the overlay to change its position.
• Right Click on any element in the overlay to edit it.
• To print the chart, please review Charts 2D ⟶ Printing Charts